
Your PMOS Blood Report Explained: A Nutritionist's Guide
Table of Contents
1. Why Your Blood Report Is Probably More Alarming Than It Needs to Be, and Less Useful Than It Should Be
2. Before You Read Anything: The Problem With Lab Reference Ranges
3. The Master PMOS Report Decoder
4. Reading the Metabolic Panel
5. Reading the Hormonal Panel
6. Reading the Thyroid and Inflammation Panel
7. What to Do When Your Numbers Are Improving
8. What to Do When Your Numbers Are Not Moving
9. Conclusion
10. FAQs
Why Your Blood Report Is Probably More Alarming Than It Needs to Be, and Less Useful Than It Should Be
Your PMOS blood report arrives in your inbox or across a doctor's desk and does one of two things. It alarms you with numbers outside reference ranges, bold flags, multiple pages of values you do not understand. Or it reassures you falsely with everything marked normal, sent home without answers, still experiencing every symptom.
Both outcomes are products of the same problem: blood reports are generated for a general population, interpreted with reference ranges calibrated for that general population, and handed to patients without context. For women with PMOS, especially Indian women, whose metabolic profile differs significantly from the populations on which most reference ranges were built, this creates systematic errors in both directions.
What this guide does This is not a medical interpretation of your specific results. It is a plain-language explanation of what each marker measures, what the optimal range is for a woman with PMOS, what your lab's reference range may be missing, and what the number actually tells you about your metabolic picture. Bring this to your next consultation. |
Before You Read Anything: The Problem With Lab Reference Ranges
The single most important thing to understand about your PMOS blood report is that the reference ranges printed on it were not designed for you.
How Reference Ranges Are Set
Laboratory reference ranges are calculated from the middle 95% of a healthy population sample. This means 2.5% of completely healthy people will fall outside the range on either end and, that is considered acceptable. The ranges are statistical averages, not clinical targets.
For PMOS specifically, this creates three problems. First, the population samples used to establish ranges are predominantly Western and non-South-Asian. Indian women's metabolic profile is different. Second, the ranges for insulin and glucose are set to catch diabetes, not to detect insulin resistance in its early stages. Third, the androgen reference ranges are broad enough that significant hyperandrogenism can fall within normal.
The Specific Gap for Indian Women
As noted in clinical commentary from diabetes.co.in: fasting glucose alone is inadequate for Indian women. Postprandial glucose rises first, and a 75g OGTT with a 2-hour reading is the appropriate screen. A woman can have a fasting glucose of 92 mg/dL which is perfectly normal by any lab's reference range but have have significant insulin resistance that has been present for years.
The rule for reading your report Always ask for your exact numerical values. Never accept just normal or abnormal. The number tells you where you are on a continuum. The label normal or abnormal tells you only whether you crossed an arbitrary statistical threshold. For PMOS management, you need the number. |
The Master PMOS Report Decoder
Use this table to read your PMOS blood report. Write your values in the 'Your number' column. Compare to the optimal range, not the lab reference range. The last two columns explain what your lab may have told you versus what the number actually means.
Test | Your number | Optimal range | Lab may say normal if | What it actually means |
METABOLIC PANEL |
| |||
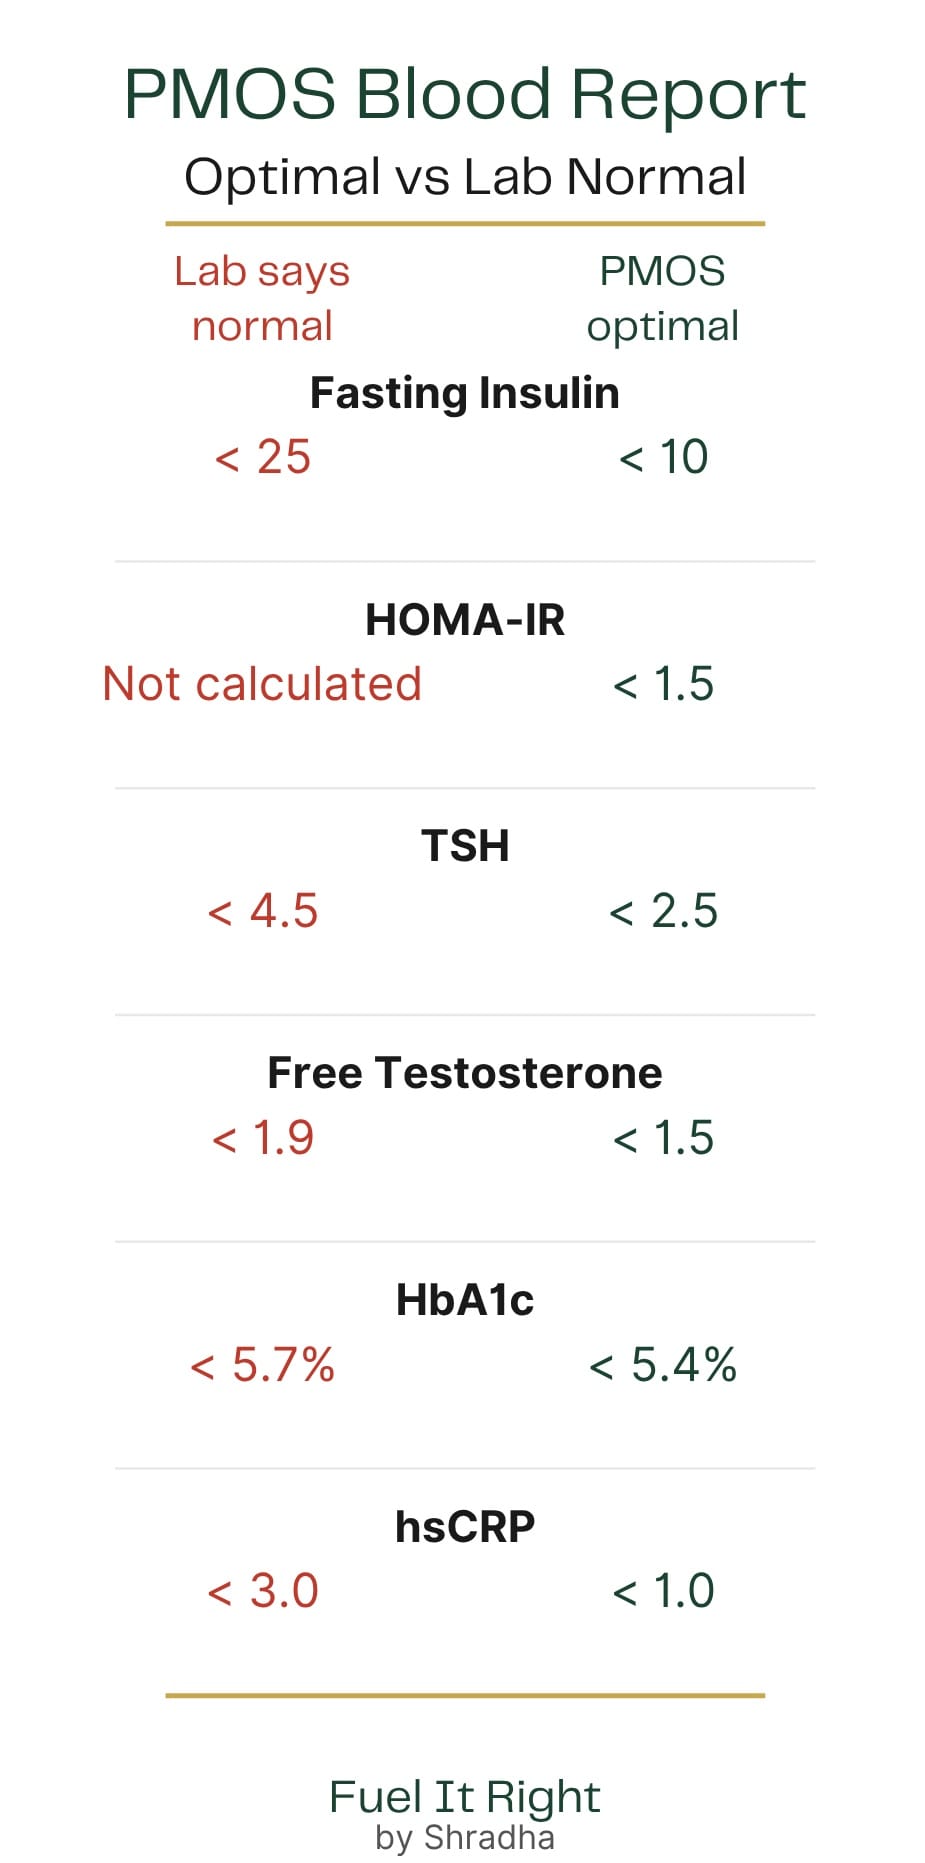
Fasting insulin | ______ | 2–10 mIU/L (optimal) | Below 25 mIU/L (diabetes threshold — not IR threshold) | Above 10: compensatory hyperinsulinemia. Above 15: significant IR. Above 20: severe IR. This is the number your doctor most likely did not order. |
HOMA-IR | ______ | Below 1.5 (optimal) | No standard range — often not calculated | Below 1.5: good insulin sensitivity. 1.5–2.5: early IR. 2.5–3.5: significant IR. Above 3.5: severe IR. Calculate: (fasting insulin x fasting glucose) / 405. |
Fasting glucose | ______ | 70–95 mg/dL (optimal) | Below 100 mg/dL | 95–99 mg/dL: borderline even within normal range. The body is compensating with extra insulin. Normal fasting glucose does not rule out IR. |
75g OGTT 2-hr | ______ | Below 120 mg/dL (optimal) | Below 140 mg/dL | 120–139 mg/dL: impaired glucose tolerance- significant metabolic risk even within normal range. This test is rarely ordered but critical for Indian women. |
HbA1c | ______ | Below 5.4% (optimal for PMOS) | Below 5.7% | 5.4–5.6%: within normal but indicates rising average glucose. 5.7–6.4%: prediabetes. The PMOS optimal target is lower than the standard normal threshold. |
Triglycerides | ______ | Below 100 mg/dL (optimal) | Below 150 mg/dL | 100–149 mg/dL: technically normal but elevated for PMOS management. High triglycerides are a direct marker of insulin resistance severity. |
HDL cholesterol | ______ | Above 60 mg/dL (optimal) | Above 40 mg/dL (women) | 40–59 mg/dL: within normal range but suboptimal. Low HDL alongside high triglycerides is the classic dyslipidaemia pattern in PMOS. |
HORMONAL PANEL |
| |||
Fasting insulin | ______ | |||
Free testosterone | ______ | 0.3–1.5 pg/mL (optimal) | Up to 1.9–2.4 pg/mL depending on lab | Values in the upper half of the reference range |
Total testosterone | ______ | 0.5–2.0 nmol/L | Up to 2.4–2.8 nmol/L | Less informative than free testosterone. A woman can have normal total T with high free T if SHBG is low. Always read total T alongside SHBG. |
SHBG | ______ | 60–100 nmol/L (optimal) | 40–120 nmol/L | Below 60: low SHBG increases free androgen activity. Low SHBG is itself a marker of insulin resistance, insulin suppresses SHBG production. |
LH/FSH ratio | ______ | Below 1.5:1 (optimal) | Both within range individually | Above 2:1: classic PMOS pattern. Elevated LH drives androgen production. Labs report LH and FSH individually. Calculate the ratio yourself. |
AMH | ______ | 1.0–3.5 ng/mL | Varies widely by lab | Above 3.5–4.0 ng/mL: elevated antral follicle count, consistent with PMOS. Below 1.0: reduced ovarian reserve. AMH can replace ultrasound as criterion 3 under 2026 PMOS update. |
DHEAS | ______ | Below 200 mcg/dL (for PMOS) | Up to 430 mcg/dL | Elevated DHEAS indicates adrenal contribution to androgen excess which is often driven by cortisol and stress. Common in lean women with PMOS and high work stress. |
Prolactin | ______ | Below 20 ng/mL | Below 25 ng/mL | Elevated prolactin can mimic PMOS symptoms like irregular periods, acne, hair fall. Rule out hyperprolactinaemia before attributing symptoms to PMOS. |
THYROID AND INFLAMMATION |
| |||
TSH | ______ | 0.5–2.5 mIU/L (optimal for PMOS) | 0.5–4.5 mIU/L (standard range) | 2.5–4.5 mIU/L: within the standard range but suboptimal for PMOS management. TSH in this range can cause fatigue, weight resistance, and worsened insulin sensitivity. |
Free T4 | ______ | 0.9–1.7 ng/dL | 0.8–1.8 ng/dL | Low-normal free T4 with high-normal TSH signals suboptimal thyroid function even within range. Always read free T4 alongside TSH, not TSH alone. |
Free T3 | ______ | 3.0–4.0 pg/mL (optimal) | 2.3–4.2 pg/mL | Low-normal free T3 can indicate poor T4 to T3 conversion affecting energy, weight, and mood even with normal TSH. Rarely ordered; worth requesting. |
hsCRP | ______ | Below 1.0 mg/L (optimal) | Below 3.0 mg/L (low risk) | 1.0–3.0 mg/L: technically low risk but indicates active inflammation driving insulin resistance. Above 3.0: high cardiovascular risk. PMOS target is below 1.0. |
Vitamin D | ______ | 40–60 ng/mL (optimal) | Above 20 ng/mL (sufficient) | 20–39 ng/mL: technically sufficient but suboptimal. Below 30: deficient. Vitamin D deficiency directly worsens insulin resistance and inflammatory markers. Extremely common in Indian women. |
Use the comparison below as a quick reference. Bring it to your consultation.
Reading the Metabolic Panel
The metabolic panel is the foundation of your PMOS blood report. These numbers tell you how severe your insulin resistance is and how much metabolic damage has accumulated. Most Indian women with PMOS have never had this panel ordered completely.
Fasting Insulin: The Number That Changes Everything
Fasting insulin is not on a standard blood panel. You have to request it by name. When it comes back, ignore the lab's reference range — labs set their insulin cut off to catch diabetes, not to detect the early insulin resistance that drives PMOS for years before diabetes develops.
The PMOS-relevant interpretation: below 10 mIU/L is optimal. 10–15 indicates mild to moderate insulin resistance. 15–20 indicates significant insulin resistance requiring dietary intervention. Above 20 indicates severe insulin resistance. In the partner-clinic data tracking over 6,000 Indian women, two-thirds saw HOMA-IR return to normal within six months on consistent body-composition-led protocols.
HOMA-IR: Calculating Your Insulin Resistance Index
Formula: (Fasting insulin in mIU/L x Fasting glucose in mg/dL) / 405. This calculation gives you a single number which is your insulin resistance index. Below 1.5 is optimal. Above 2.5 is clinically significant and requires metabolic intervention. Above 3.5 is severe.
Write the number here: ______. This is your baseline. Every food change, every lifestyle shift, every intervention you make should be measured against this number over the next 3 to 6 months.
Triglycerides and HDL: The Metabolic Pattern
The classic PMOS dyslipidemia pattern is high triglycerides alongside low HDL. If your triglycerides are above 100 mg/dL and your HDL is below 55 mg/dL, this pattern is present, regardless of whether your total cholesterol looks normal. This combination increases cardiovascular risk and indicates active insulin resistance.
Reading the Hormonal Panel
The hormonal component of your PMOS blood report is where most Indian women focus and where the most confusion about reference ranges exists.
Free Testosterone vs Total Testosterone
If your report shows only total testosterone, it is incomplete. Free testosterone, the biologically active fraction, is what drives androgenic symptoms. A woman can have normal total testosterone with high free testosterone if her SHBG is low. This is one of the most common missed patterns in lean PMOS.
Read your SHBG alongside your testosterone. If SHBG is below 60 nmol/L, your free androgen activity is higher than your total testosterone suggests. Low SHBG is itself a direct marker of insulin resistance, insulin suppresses SHBG production, so low SHBG tells you insulin resistance is active even without seeing the fasting insulin result.
The LH/FSH Ratio: Calculate It Yourself
Your lab will report LH and FSH as individual values, both likely within their respective reference ranges. But the ratio tells a different story. Divide your LH value by your FSH value. Above 2:1 is the classic PMOS pattern, elevated LH drives androgen production in the ovaries and disrupts follicle development.
These tests are most accurate on Day 2 to 4 of your cycle. If you had them drawn at another time, the values may not reflect your typical hormonal state.
AMH: More Than a Fertility Marker
AMH, the Anti-Mullerian Hormone, is typically ordered as a fertility marker. In the context of PMOS, it also reflects antral follicle count. Under the 2026 PMOS update, elevated AMH above 3.3–4.0 ng/mL can substitute for polycystic ovarian morphology on ultrasound as criterion 3 for diagnosis. If your AMH is elevated and you have other PMOS markers, ultrasound cysts are not required for diagnosis.
Reading the Thyroid and Inflammation Panel
The thyroid section of your PMOS blood report is where the most clinically significant misinterpretations occur because the standard TSH reference range is too wide to catch the suboptimal thyroid function that worsens PMOS.
The TSH Misinterpretation
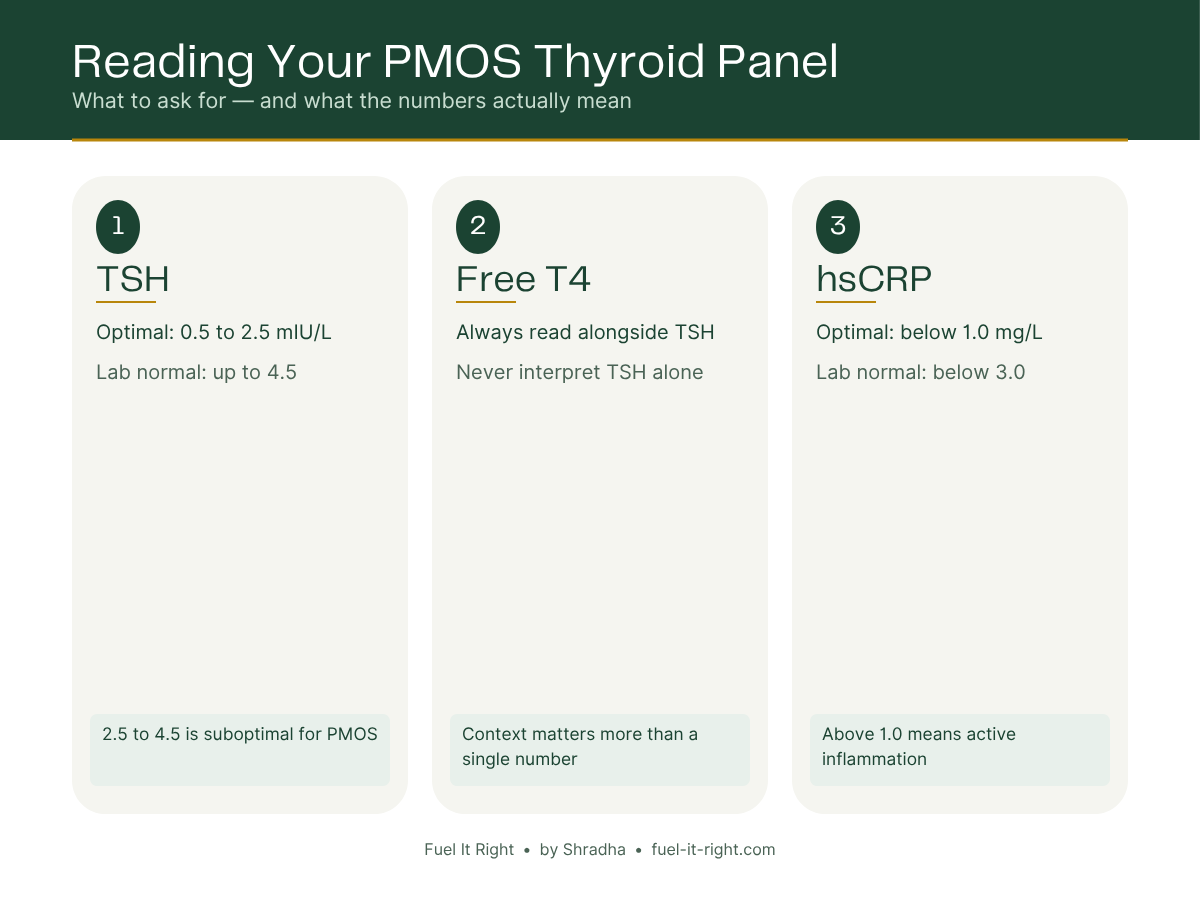
Standard labs flag TSH as normal up to 4.5 or even 5.0 mIU/L. For a woman with PMOS, a TSH above 2.5 mIU/L warrants further investigation. In the range 2.5 to 4.5 mIU/L, she may have fatigue, weight resistance, mood changes, and worsened insulin sensitivity, all attributed to PMOS or lifestyle, while her thyroid is actually the driver.
Always read free T4 alongside TSH. A TSH of 3.2 with a free T4 of 0.85 ng/dL indicates suboptimal thyroid function. Treating only the PMOS while leaving this unaddressed will limit results significantly.
hsCRP: Your Inflammation Marker
High-sensitivity CRP above 1.0 mg/L indicates active systemic inflammation. In the context of PMOS, chronic low-grade inflammation directly worsens insulin resistance, it is both a consequence of PMOS and a driver of it. If your hsCRP is above 1.0 mg/L, anti-inflammatory consumption of haldi, jeera, methi, seasonal vegetables, gut health focus, is not optional. It is the primary metabolic intervention.
What to Do When Your Numbers Are Improving
When your PMOS blood report shows improvement, HOMA-IR dropping, testosterone coming down, TSH moving toward optimal, here is what that means and what to continue:
• HOMA-IR below 2.0 from a higher baseline: insulin resistance is responding. The food protocol is working. Do not change what is working. Continue protein-first meals, fibre at every meal, curd daily.
• Free testosterone dropping toward 0.8–1.0 pg/mL: androgens are reducing as insulin comes down. Acne and hair fall should begin improving within 2 to 3 months of the androgen reduction.
• TSH moving toward 1.5–2.0 mIU/L: thyroid is improving. This supports better metabolism, energy, and mood.
• hsCRP below 1.0 mg/L: inflammation is controlled. Continue anti-inflammatory spices and gut-focused eating.
• LH/FSH ratio moving toward 1:1: ovulation is regularising. Cycle length should be improving alongside this number.
Retest timeline for PMOS markers Fasting insulin and HOMA-IR: every 3 months when actively managing PMOS through food. Testosterone and SHBG: every 6 months. TSH and free T4: every 6 months. HbA1c and lipid panel: every 6 months. hsCRP: every 3 months during active intervention. |
What to Do When Your Numbers Are Not Moving
If your PMOS blood report shows no improvement after 3 to 6 months of dietary changes, here are the most common reasons, and what to address:
1 | Gut health has not been addressed The gut microbiome directly affects how hormones are processed and how inflammation is managed. If gut health is compromised, dietary changes have a reduced metabolic impact. Start with the 3-Day Indian Gut Reset and build from there. |
2 | Cortisol is the primary driver If you are under chronic high stress, cortisol directly worsens insulin resistance and raises LH regardless of what you eat. DHEAS will be elevated on your report. Stress management is not optional when cortisol is the driver. |
3 | Thyroid is undertreated If TSH is above 2.5 mIU/L and not being addressed, thyroid dysfunction will limit metabolic improvement. The two conditions reinforce each other. Both need to be managed simultaneously. |
4 | The food protocol is not being applied consistently Protein-first meals, curd daily, and carbs last must be consistent, not occasional. Intermittent consistency produces intermittent results. |
5 | Medical intervention is needed alongside food For some women, fasting insulin above 20 mIU/L requires pharmacological support, Metformin or an equivalent, alongside dietary management. Food-first is the philosophy. It does not mean food-only when insulin resistance is severe. |
Conclusion: Your Report Is a Map, Not a Verdict
Your PMOS blood report is not a life sentence and it is not a mystery. Every number on it is measuring something specific about your metabolic and hormonal state, and every one of those things responds to food, to timing, to consistency, and to understanding what you are actually treating.
As noted by Meto Health: elevated testosterone explains the acne. High fasting insulin explains the weight that does not respond to standard dietary approaches. A disrupted LH/FSH ratio explains the cycle irregularity. Individually, these values are numbers. Together, read in clinical context, they are a map. One that points toward root causes rather than surface-level symptom management.
Bring this guide to your next consultation. Write your numbers into the decoder table. Ask your doctor to explain any value that falls outside the PMOS-optimal range, not just the lab reference range. And if you want help understanding what your specific results mean and what food protocol to build around them, book a free 30-minute discovery call.
Book a Free 30-Minute Discovery Call
Bring your blood reports. We will go through every number and tell you exactly what it means for your food protocol.
FAQs: Reading Your PMOS Blood Report
Q1. My lab says my fasting insulin is normal but I still have all the PMOS symptoms. What does this mean?
Laboratory reference ranges for fasting insulin are set to detect diabetes, not early insulin resistance. A fasting insulin of 18 mIU/L may fall within your lab's normal range while indicating significant insulin resistance in the PMOS context. Ask your doctor to calculate your HOMA-IR and compare it to the PMOS-optimal target of below 1.5, not just the lab threshold.
Q2. My TSH is 3.1 and the lab says it is normal. Should I be concerned?
For a woman with PMOS, a TSH above 2.5 mIU/L warrants further investigation even though standard lab ranges go up to 4.5 mIU/L. In the range 2.5 to 4.5, suboptimal thyroid function can cause fatigue, weight resistance, mood changes, and worsened insulin sensitivity. Ask for free T4 alongside TSH, and discuss whether your thyroid requires management.
Q3. My testosterone is within the normal range but I have significant acne and hair fall. Why?
Because reference ranges are broad and free testosterone is more relevant than total testosterone. A woman with total testosterone in the upper half of the normal range but low SHBG has significantly elevated free testosterone, which drives androgenic symptoms even within the normal total testosterone range. Always ask for free testosterone and SHBG alongside total testosterone.
Q4. What does a low SHBG result mean for my PMOS?
Low SHBG, below 60 nmol/L, means more testosterone is free and biologically active in your tissues. It is also a direct marker of insulin resistance: insulin suppresses SHBG production, so when insulin is chronically elevated, SHBG drops. A low SHBG result tells you insulin resistance is active even without seeing your fasting insulin number.
Q5. How often should I retest my PMOS blood markers?
Fasting insulin and HOMA-IR: every 3 months when actively managing through food. Testosterone, SHBG, and LH/FSH: every 6 months. TSH and free T4: every 6 months or sooner if symptoms change. HbA1c and lipid panel: every 6 months. hsCRP: every 3 months during active dietary intervention.
Q6. My HOMA-IR was 3.8 six months ago. It is now 2.4. Is that good progress?
Yes, significantly. Moving HOMA-IR from 3.8 to 2.4 indicates meaningful improvement in insulin sensitivity, the metabolic root of PMOS, is responding. You are still in the significant insulin resistance range above 2.5, but the direction and magnitude of change is exactly what the food protocol should be producing. Continue and retest in 3 months.
Q7. My AMH is 5.8 ng/mL. What does this mean?
An AMH above 3.5 to 4.0 ng/mL is elevated and consistent with PMOS. It reflects a high antral follicle count, many follicles developing but not maturing to ovulation, which is characteristic of PMOS. Under the 2026 PMOS update, elevated AMH can now substitute for polycystic ovarian morphology on ultrasound as the third diagnostic criterion.
Q8. My blood report is improving but I still feel tired and my periods are still irregular. Why?
Blood markers improve before symptoms resolve means there is typically a 2 to 3 month lag between metabolic improvement and visible symptomatic change. Testosterone must drop meaningfully before acne and hair fall improve. Insulin must reach near-optimal levels before ovulation regularises consistently. If markers are improving, continue the protocol and allow time for the hormonal cascade to adjust.
About the Author
Shradha | Nutritionist & Dietitian | Fuel It Right. Practising out of Goa, India, with a focus on gut health, PMOS/PCOS, thyroid disorders, and weight management using real Indian food. No supplements. No machines. Just food, and the science behind it.
fuel-it-right.com | @fuelitright